 Dashboard flags
The 'New', 'Assigned' and 'Waiting for patient' counts on the top level of the dashboard will provide details relating to the number of requests currently in each of those three states where there are either Urgent or Emergency flags applied:

Where no urgent, or emergency flagged requests are present in a list, the dashboard will show these flag counts as zero.
If you need to review the flagged requests, you can select 'Requests' in the left-hand menu and then choose the relevant filter (New, Assigned, or Waiting for patient) to locate and review any flagged requests.
Note: There is no flagging in any of the other lists within the dashboard, only the first three which reflect the current status of open requests.
You can identify who the flagged requests are currently assigned to by reviewing the 'Priority' column next to each staff member on the dashboard:
 Dashboard overview
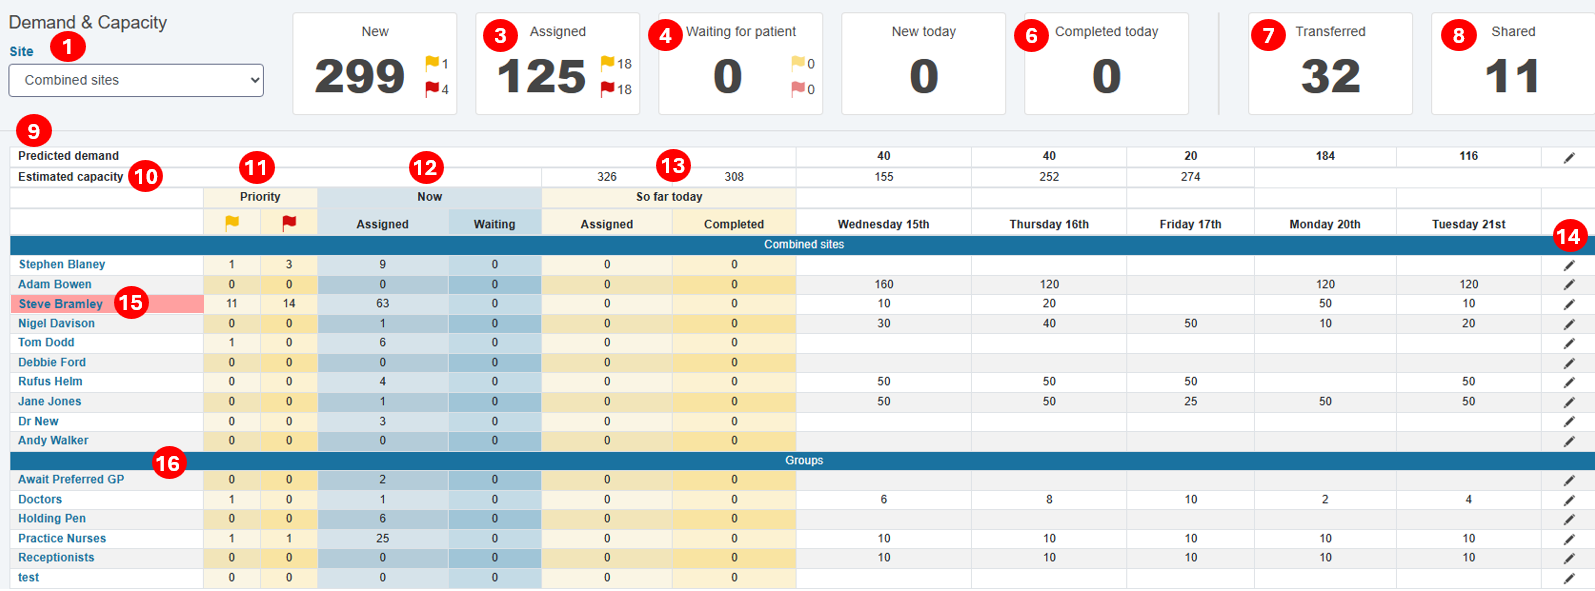
This is your overview of Demand and Capacity for today and the week ahead for individuals and groups.
1. Choose Your Site
In a multi-site practice, using the drop-down arrow. you can either choose one site to view, or, view all sites together. NB The top line boxes (to the right) show today for all sites.
Use the "Combined Sites" view to view capacity and workload for all sites together.
Clinicians may have sessions at multiple sites and their capacity is therefore split between sites.
2. New Requests
This is the current count of new patient requests that are not yet assigned to anyone or any group.
3. Assigned Requests
This is the current count of requests assigned to either a staff member or a group.
4. Waiting for the Patient to Respond
This is the current count of requests waiting for a patient to respond to a message from the Practice.
(Note, you can view all currently waiting requests by going to 'Requests' clicking the 'Waiting' list and then 'Show all' click here for more details)
5. New Requests Received Today
This is the cumulative total of patient requests received today. This resets to zero at Midnight.
6. Completed Requests
This is the cumulative total number of patient requests completed today. This resets to zero at Midnight.
9. Predicted Demand
The Predicted Demand fields for each day are automatically filled based on your practice list size and the values entered on the 'Capacity Planning' section of the system (See https://evergreenlife.freshdesk.com/support/solutions/articles/14000145204-capacity-planning for more information).
10. Estimated Capacity
This is the estimated total capacity for the practice each day. Capacity is broken down for groups and individuals by name in the column below. The aim to make this as close to the Predicted Demand as possible for the day.
11. Priority
Allows you to see how many priority flagged requests are assigned to each member of staff.
12. Now
These two columns show the number of patient requests currently assigned to each clinician and groups and the number of patients from whom you are waiting for a response.
13. So far today
These daily totals are helpful for ensuring each clinician, or group, is allocated a fair number of patient requests each day.
Both counts reset to zero at midnight.
14. Editing Staff Weekly Rotas
The superuser can change the estimated capacity for each clinician by clicking on the pen icon. This will take you to a different screen where you can enter updated information.
Remember to save your changes.
15. Requests but no capacity
If a name is highlighted in pink it means that person has requests assigned to them at a site, but no capacity allocated to address them. This is only generated in multi-site locations.
16. Groups
Superusers can edit the capacity for each group which counts towards the total capacity available each day.
Useful to know:
- During the day, the sorter should be looking at the so far today column as that shows how many are assigned to each clinician/group for that day. This is the number that is reflected in the assign screen.The number will be updated if others in the team have assigned tasks to the individual and reduced if they assign to others in the team.
- The Now column highlights where the individual may have requests open from previous days, if a request comes out of waiting it will increase this figure and reduce the waiting number.
- The blue and yellow colours on the dashboard are to help the user see the appropriate figures for each individual and aid clarity.